


A Forage Virtual Internship Program with TATA Insights & Quants
The following project was a prerequisite for the completion of the virtual experience programme with Tata Insights and Quants or Tata iQ, made possible by Forage.
SCENARIO
I have been hired by an online retail store as a consultant to review their data and provide insights that would be valuable to the CEO and CMO of the business. The business has been performing well and the management wants to analyse what the major contributing factors are to the revenue so they can strategically plan for next year. The leadership is interested in viewing the metrics from both an operations and marketing perspective. Management also intends to expand the business and is interested in seeking guidance into areas that are performing well so they can keep a clear focus on what’s working. They would also like to view different metrics based on the demographic information that is available in the data.
Data Structure
The data was in a Microsoft Excel Worksheet(.xlsx) format, and contained just a single sheet, hence there was no need for creating a relationship. The sheet had the following columns:
- Invoice No.
- Stock code
- Description
- Quantity
- Invoice Date
- Unit price
- Customer ID
- Country
My Approach
Understanding The Task
The Management would like to know what the drivers are for their business and then would like to use the insights from this as a guidance to expand the business more. This was the primary request of the CEO and CMO, so anything outside this is just deviation from primary objective.
Data Preparation and Processing
PowerBI was my choice tool for this analysis. After importing my dataset into PowerBI as an .xlsx document, I proceeded to change the data types to appropriate values where necessary eg. all columns not needed for any form of calculation should be considered as text.
There were some negative values under quantity as a result of returned purchases, so I used the PowerQuerry filter to exclude any quantity below 1 from my analysis. Also the unit prices contained some erroneous entries which were below $0, so I also excluded all unit price values below $0 from my analysis.
My column distribution indicated that there were some duplicates, so I removed duplicates based on every entry, because having multiple values on a single column doesn't necessarily translate to duplicates.
After checking for nulls using column quality, I discovered about 25% null values in customer ID column, this was too huge to be an entry error; upon further investigation I realized that this was as a result of certain customers not being comfortable documenting their identity. Removing this null values would greatly skew the analysis, hence I decided to change the nulls to No ID.
After my data has been scrubbed clean, I proceeded to close and apply.
Analysis and Insights
I needed to have a revenue column as this was important in most of the metrics I'll be using to determine the state of the business, hence I used DAX to create a calculated column called Revenue (revenue is calculated as unit price x quantity sold).
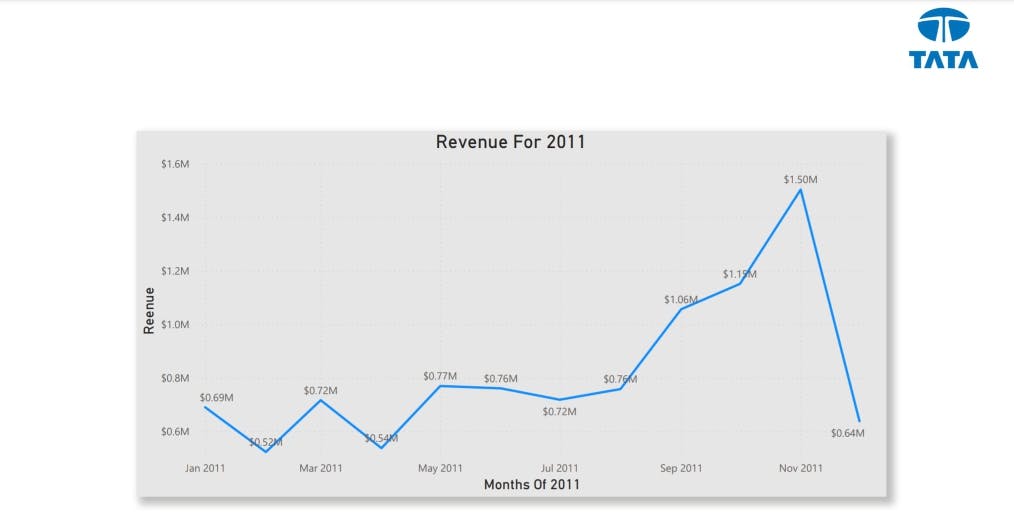
~Revenue Trend:
According to the CEO's request, my examination of the revenue pattern reveals that there are select months of the year that have remarkable growth. According to the data, the first eight months' sales were very stable, with an average of $685k in revenue each month. The revenue rises by 40% over the prior month in September, marking the beginning of the revenue boom. This pattern persisted up until November, when it rose to 1.5 million USD, the greatest amount of the entire year. Unfortunately, since the data for December is lacking, no inferences can be made from it. This analysis demonstrates how seasonality, which typically occurs in the last four months of the year, affects retail store sales.
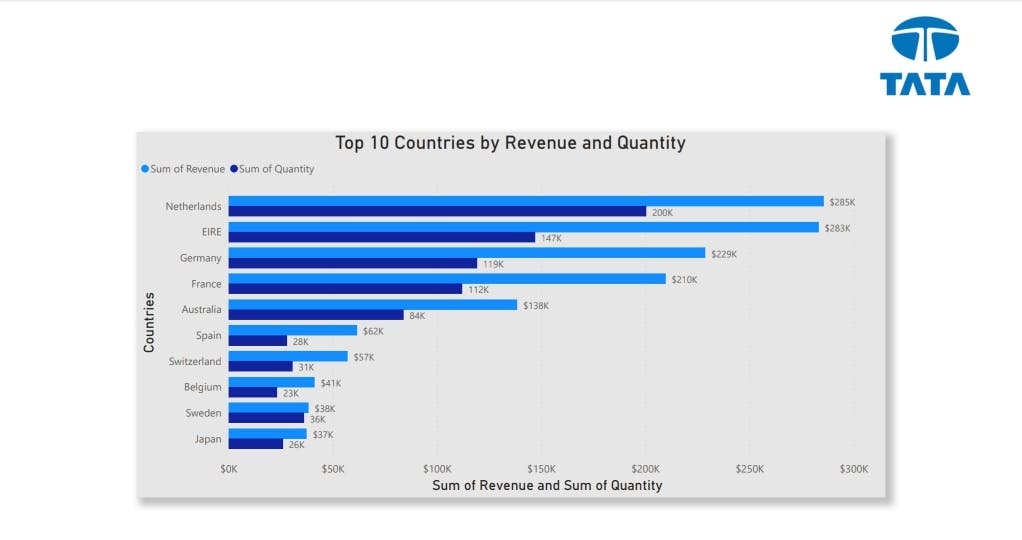
~Countries by Revenue and Quantity:
The second visual shows how the top 10 countries which have opportunities for growth are performing. This data is focused on the countries where demand can be increased as per the CMO's request, hence the UK has been excluded since it already has high demand. My analysis shows that the Netherlands, Éire, Germany, France and Australia are the countries with high volumes of units bought and revenue generated. I advise that an expansion strategy should be initiated to target these regions and generate more business growth.
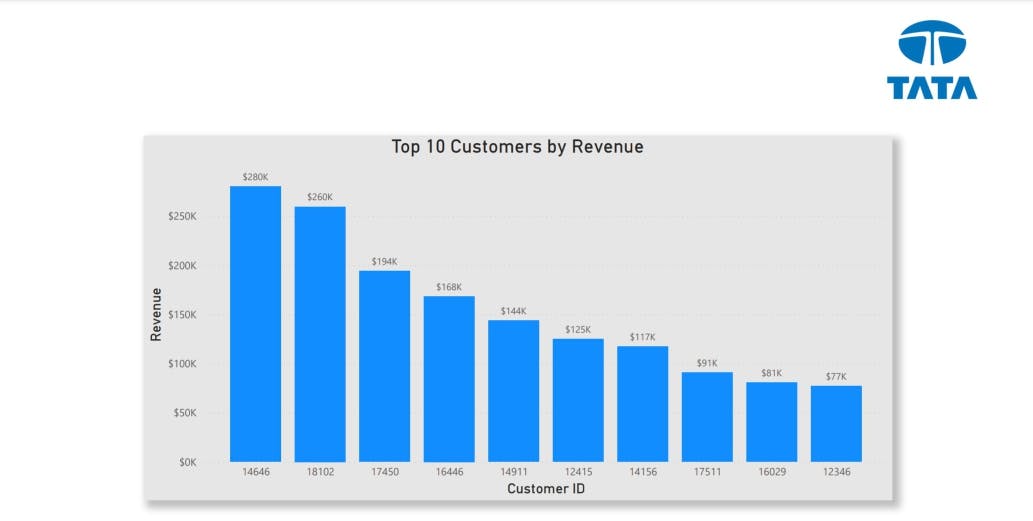
~Understanding Customers' Purchasing Power:
The top 10 consumers who have made the most purchases from the store were the subject of this investigation. According to the data, there aren't many differences between the top 10 customers' purchases. The fact that the highest revenue-producing customer only spent 17% more than the second-highest demonstrates that the company does not rely solely on a small number of consumers to generate income. This demonstrates that the company is in a strong position and that the customer's power of negotiation is low. If the reverse was the case, then the company would need to diversify it's customer base in other to gain upper hand in customers negotiation power.
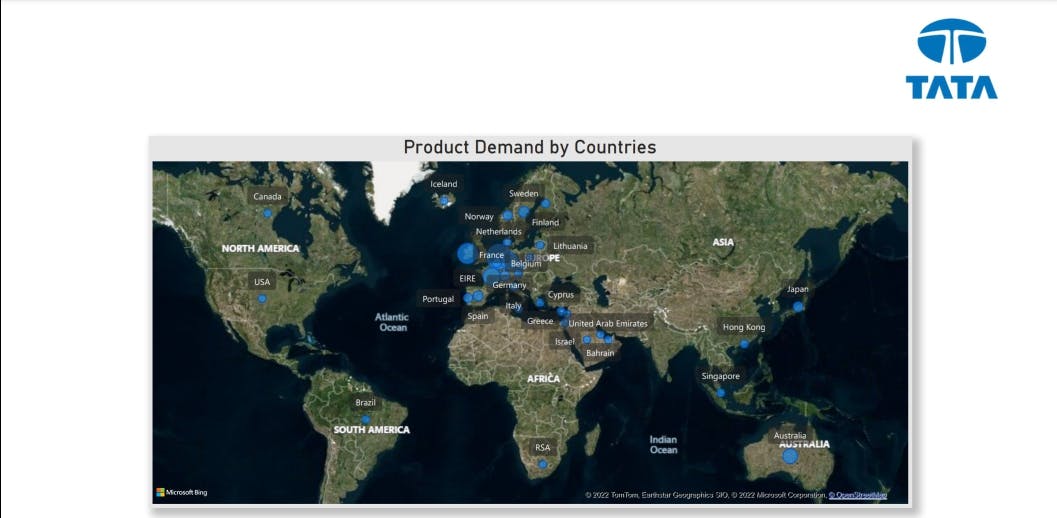
~Product Demand Across Regions:
This map chart contrasts the regions that have and have not produced the highest revenue to illustrate which regions have. Apart from the UK, it is clear that nations like the Netherlands, Éire, Germany, France, and Australia generate significant revenue, and the business should make additional investments there to boost product demand. The map also reveals that the majority of sales occur only in the European zone, with only a small number in the American region. Asia, Africa, and Russia have no market demands for the products, hence there is a large market opportunity in these places, which will increase earnings and profitability.
Conclusion
The above analysis is expected to provide a reasonable amount of insights/guidance to the management in their quest for business expansion, but any more analysis needed, or suggestions would be highly appreciated. Thank you.