


I recently took part in a community learning program called #10DaysofPowerBI where I learnt to extract, process, analyze and visualize Data among other things. As a requirement for being considered to have completed the program, I had to work on the following project.
SCENARIO
I’ve just been hired by a Bike Sales Company in Europe to analyze the sales data from 2011 to 2016. My job is to design a sales dashboard/report for the Executives to help them
track revenue and profit generated.
Some questions i’m required to answer in my analysis are:
The Total Revenue, Total Sales, Total Unit, Gross profit margin and Total no. of customers
Top 5 Countries with highest revenue and profit generated
The Age group distribution of gender by Revenue
A sales trend showing the revenue generated each month
Top 5 Product and subcategory by Profit
Bottom 5 Product and subcategory by Profit.
Data Structure
The Data was originally gotten from Kaggle, but has been modified by the anchor of the program to be a bit more challenging.
The dataset contained 18 columns in a csv file.
• The Date column contains the date the sales was made in month/date/year format
• The Day, Month and Year column contains the day, month and year the sales were made respectively
• The Customer Age column contains the Age of the customer.
• The Age group column contains the age of customers grouped in ranges
• The Customer Gender column contains the gender of the customer, F for Female, M for Male.
• The Country and State column contains the country and the State the sales were made in.
• The Product category, Subcategory and Product name of the products.
• The Order Quantity contains the unit of product sold
• The Unit Cost contains the cost price of a unit product
• The Unit Price contains the selling price of a unit product
• The Profit contains the profit generated which is Revenue – Cost
• The Cost contains the cost of the sales in dollars
• The Revenue column contains the amount generated from the sales in dollars.
My Approach
Understanding The Task
It's almost instinctive to want to jump right into the preparation and analysis stage of the process, but the most important part of the entire process is to understand the problem statement. This helps to guide us along the right path and eliminates any unnecessary detours that wouldn't generate any meaningful insights for the company.
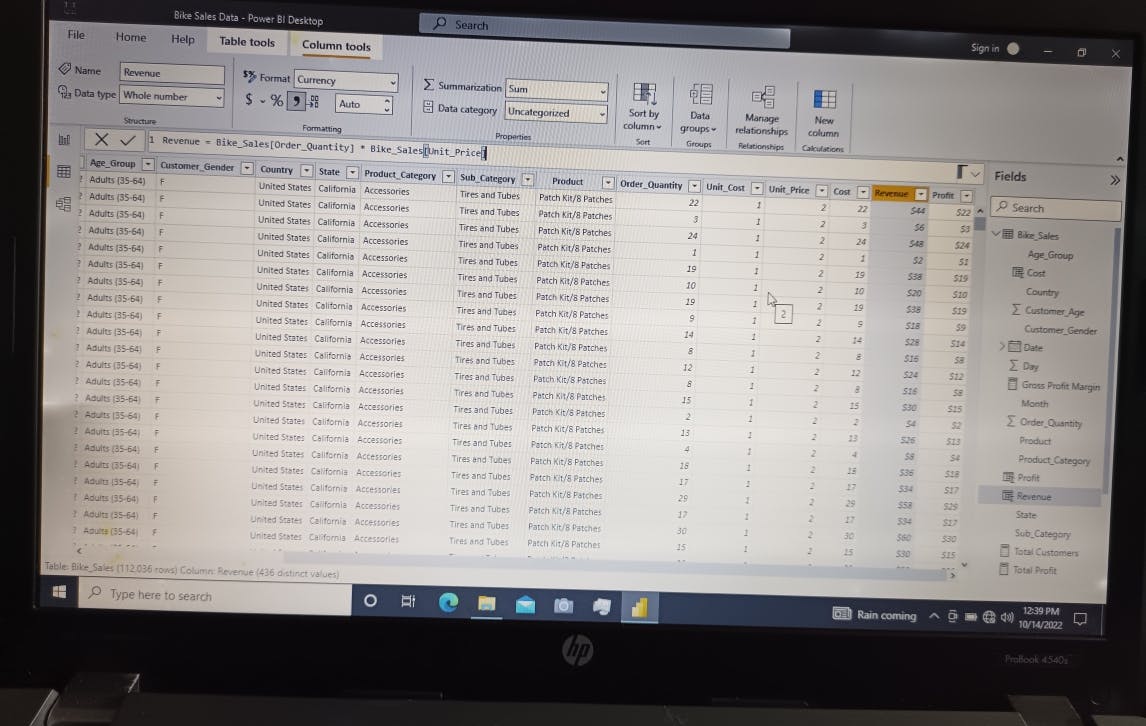
Data Preparation and Processing
In this stage, I did some research to understand the different metrics that I would need for my analysis, after which I imported the dataset which was in CSV format into PowerBI. After importing my dataset into PowerBI and transforming it using Powerquerry, I proceeded to check for inaccuracies, duplicates, and nulls in the data during which I discovered that the formula used in calculating the Revenue Column was wrong, I had to use the right formula (Revenue = Order Quantity × Unit Cost) to generate a calculated column in it's place.
 The entire dataset was on a single table, hence there was no need for Data Modeling.
Analysis and Insights
PowerBI was my tool of choice since this can help me create interactive dashboards and also easily manipulate the data. The following are screenshots of some the analysis I did, the complete dashboard can be found below.
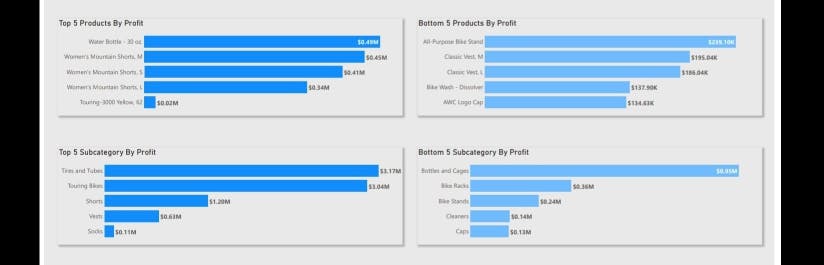
~Product Analysis:
This was done to determine the Top 5 Product and subcategory by Profit
and Bottom 5 Product and subcategory by Profit.
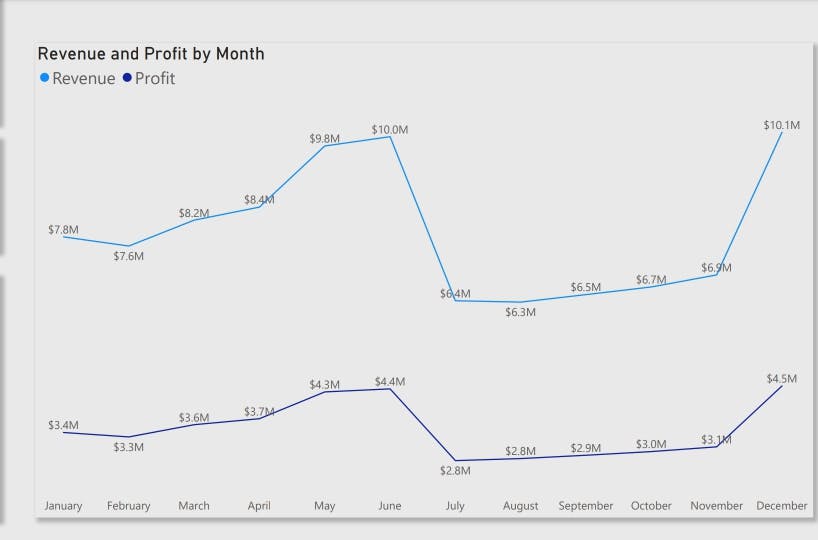
~Time Series Analysis: I needed to know the sales trend according to the time frame given in terms of month and year, hence the need for this analysis.
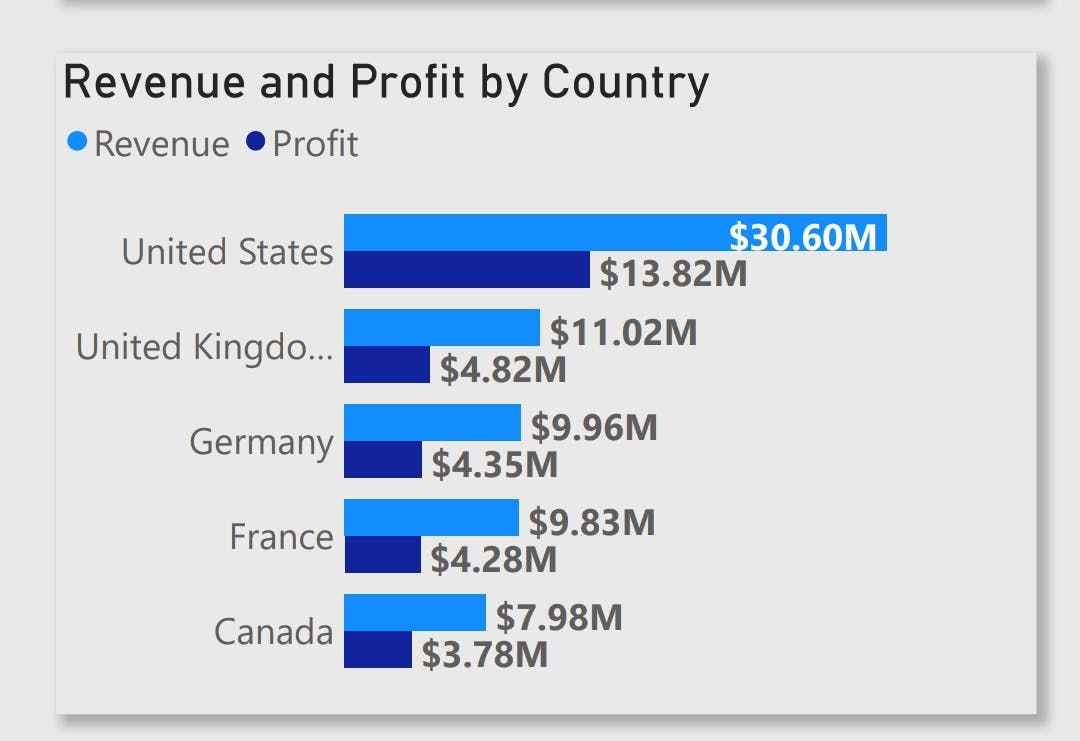
~Location Analysis: This was done to find out the best and worst performing countries in terms of Revenue and Profit. This analysis revealed that Is US was the best performing country, while Canada was the worst performing.
The Big Picture
Not losing sight of the required task; which was to design a sales dashboard for the Executives to help them track revenue and profit generated, I used the insights gathered from my analysis to design the following dashboard.
I also took the initiative to make the following Recommendations
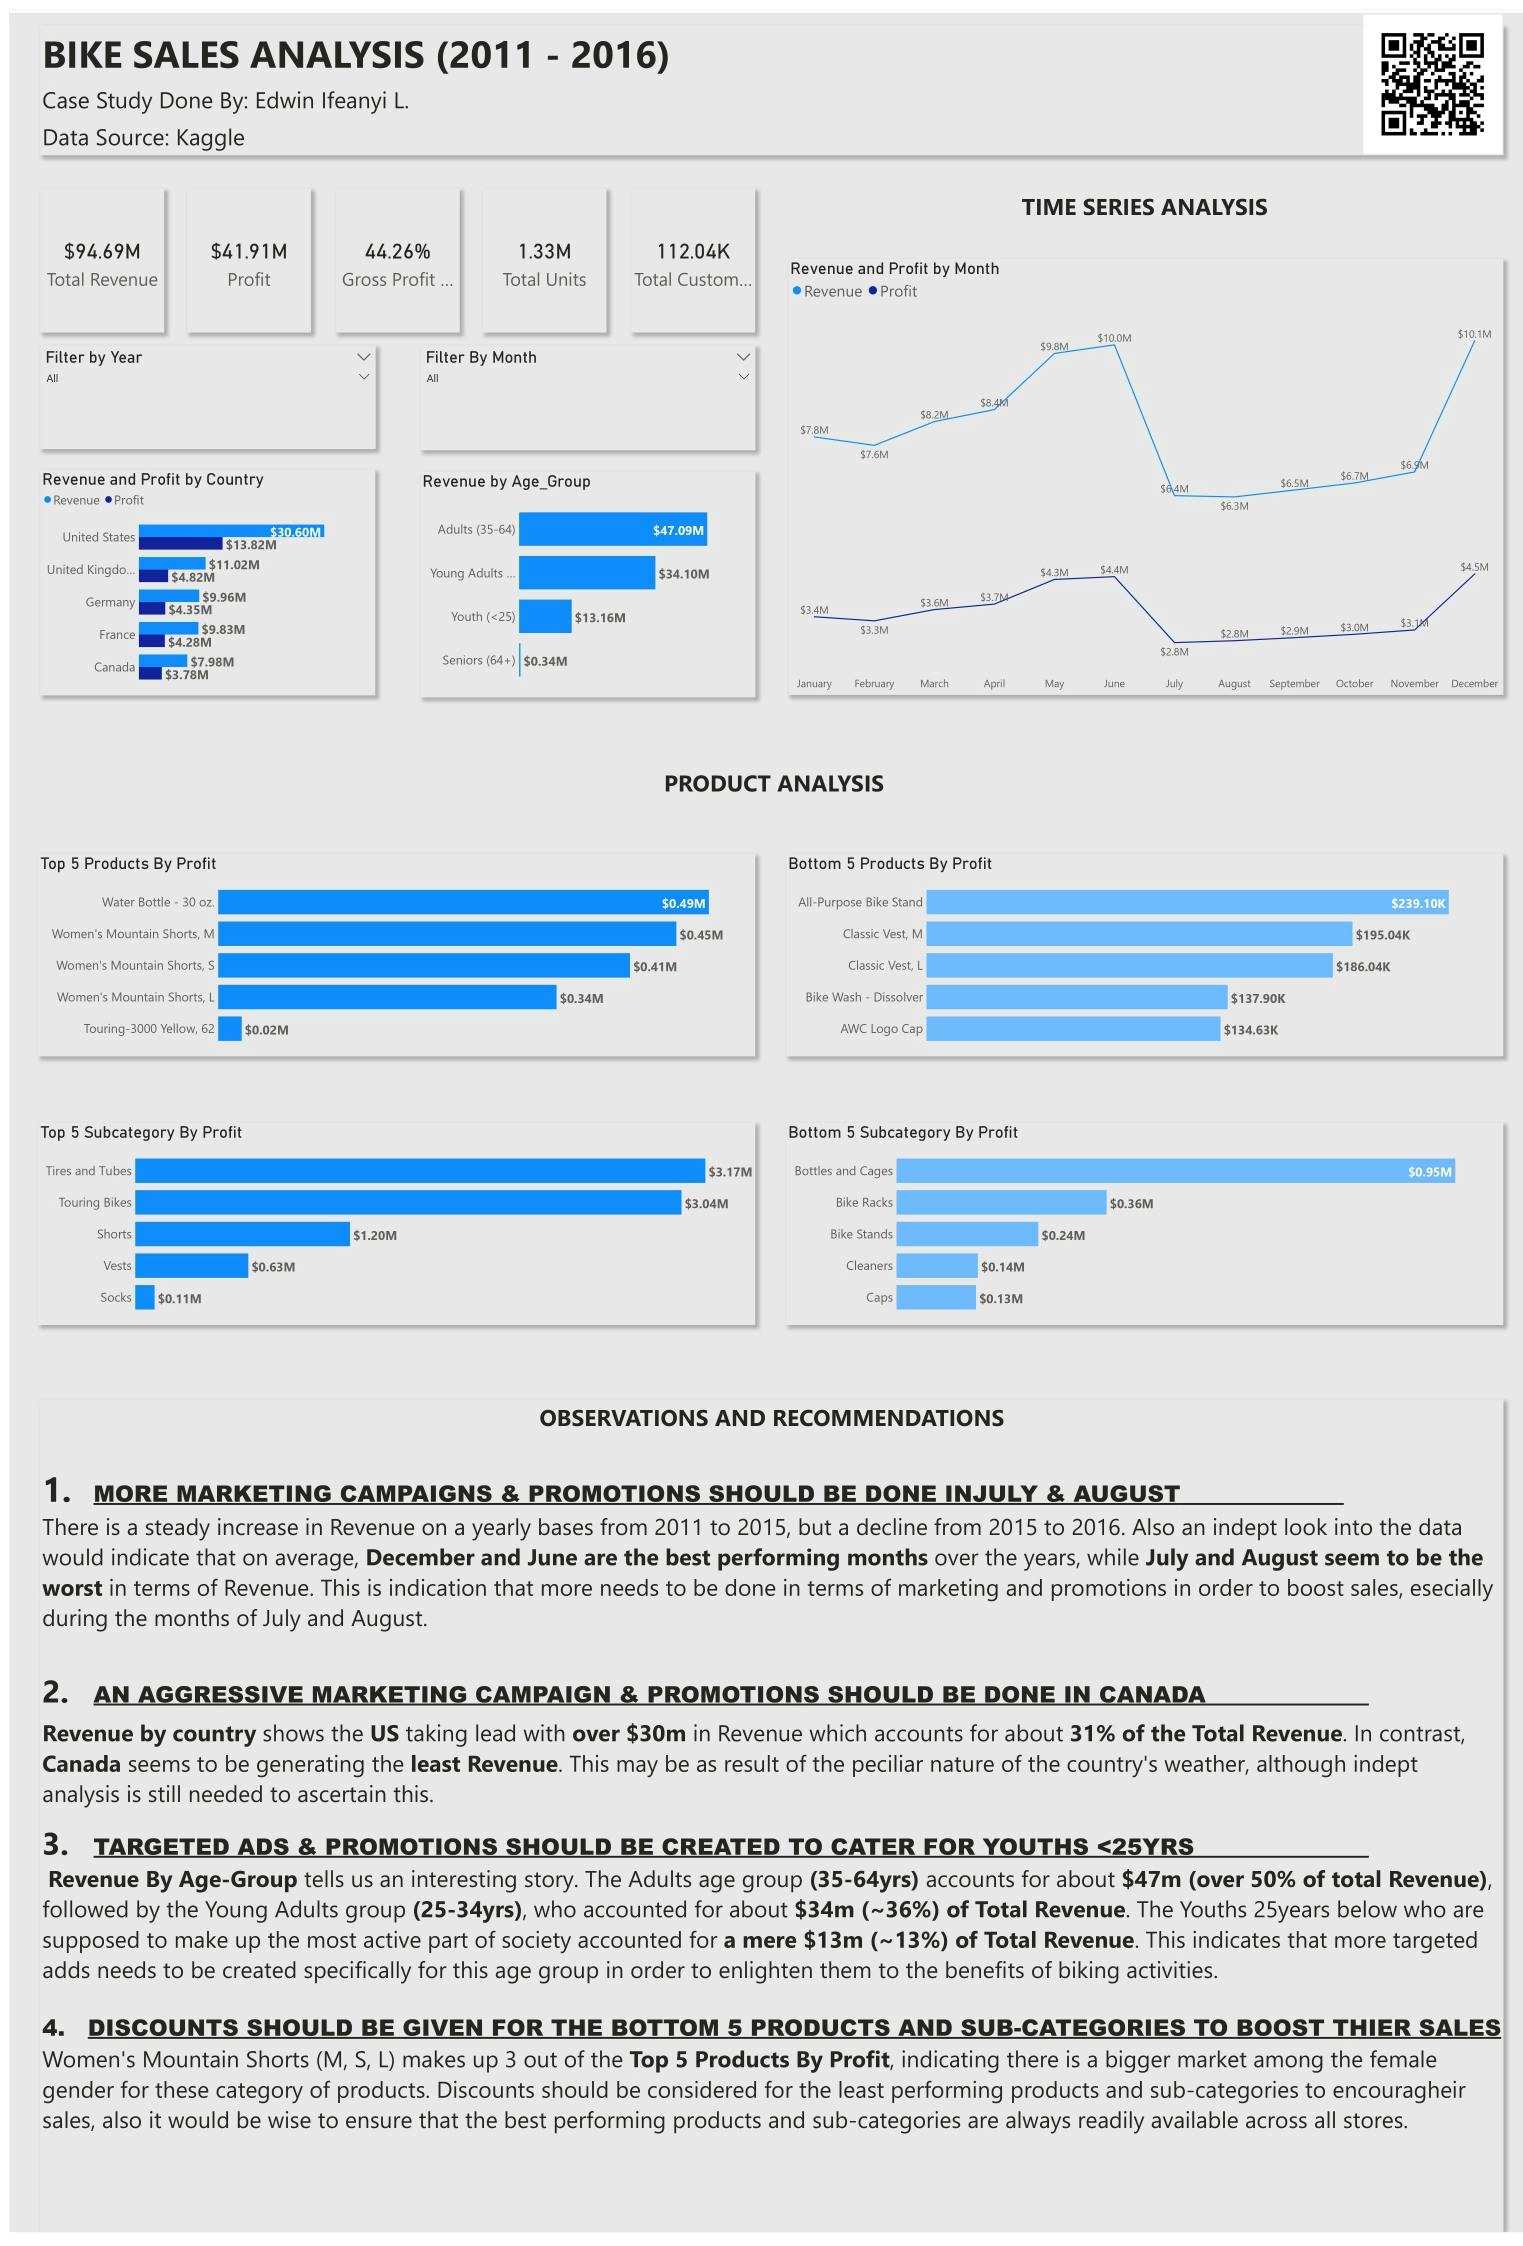
MORE MARKETING CAMPAIGNS & PROMOTIONS SHOULD BE DONE IN JULY & AUGUST There is a steady increase in Revenue on a yearly bases from 2011 to 2015, but a decline from 2015 to 2016. Also an indept look into the data would indicate that on average, December and June are the best performing months over the years, while July and August seem to be the worst in terms of Revenue. This is indication that more needs to be done in terms of marketing and promotions in order to boost sales, especially during the months of July and August.
AN AGGRESSIVE MARKETING CAMPAIGN & PROMOTIONS SHOULD BE DONE IN CANADA Revenue by country shows the US taking lead with over $30m in Revenue which accounts for about 31% of the Total Revenue. In contrast, Canada seems to be generating the least Revenue. This may be as result of the peciliar nature of the country's weather, although indept analysis is still needed to ascertain this.
TARGETED ADS & PROMOTIONS SHOULD BE CREATED TO CATER FOR YOUTHS <25YRS Revenue By Age-Group tells us an interesting story. The Adults age group (35-64yrs) accounts for about $47m (over 50% of total Revenue), followed by the Young Adults group (25-34yrs), who accounted for about $34m (~36%) of Total Revenue. The Youths 25years below who are supposed to make up the most active part of society accounted for a mere $13m (~13%) of Total Revenue. This indicates that more targeted adds needs to be created specifically for this age group in order to enlighten them to the benefits of biking activities.
DISCOUNTS SHOULD BE GIVEN FOR THE BOTTOM 5 PRODUCTS AND SUB-CATEGORIES TO BOOST THIER SALES Women's Mountain Shorts (M, S, L) makes up 3 out of the Top 5 Products By Profit, indicating there is a bigger market among the female gender for these category of products. Discounts should be considered for the least performing products and sub-categories to encourage their sales, also it would be wise to ensure that the best performing products and sub-categories are always readily available across all stores.